StormTrak
From your first weather check to a closer look at the storm.
24 chapters · Working edition 1.0 · November 1, 2026
Contents · 24 chapters
An illustrated field guide
From your first weather check to a closer look at the storm.
Working edition 1.0 • November 1, 2026
This guide is for people opening a weather map for the first time and for readers who want to examine radar products, observations and forecasts in detail. Start with the quick tour. Then follow the chapters that answer your questions.
The screenshots show the public StormTrak application during a November 1, 2026 browser review. They are examples from that session, not current weather. The release documentation used for the new map tools is 20261101-maptools1. The coverage notes at the end distinguish controls exercised in the live application from result scenarios still awaiting verification.
Back to the beginning ↑01 • Your first five minutes
StormTrak begins with a place. The selected location connects the local briefing, weather observations, forecasts and storm information. Moving the map lets you look around; selecting a different place changes the location being monitored.
- Open StormTrak.
- Enter a city and state, ZIP code, or coordinates in the location search. Select a matching suggestion or press the search arrow. The walkthrough in this guide uses Norman, Oklahoma.
- Read the location heading. A city or ZIP search may select an approximate center. Use Place a pin when a particular point matters.
- Read What matters today before studying the map. Open any alert card and read its status, timing and official wording.
- Read What's happening in the briefing. Compare its radar observation time with the forecast issue time below it.
- Use National radar for a broad view or a single-station reflectivity product for a closer look. Read the product name and timestamp together.
- Press Play to inspect available radar frames. Press Latest when you want to return to the newest frame.
Start here: the Hot List, the local briefing, and the radar time answer three useful questions: what needs attention, what is being observed near this place, and how recent that view is.
An easy practice session
Search for a familiar public city, open Live Observations, and find the station name, distance and report time. Then open the forecast. Notice that the station reading and the forecast can legitimately differ: they refer to different places, times and kinds of information.
The Explore an example control opens a labeled simulation for learning. Read the example label and use the live-weather return control when finished. The simulation is not a report about your selected real location.
Back to the beginning ↑02 • Find your way around
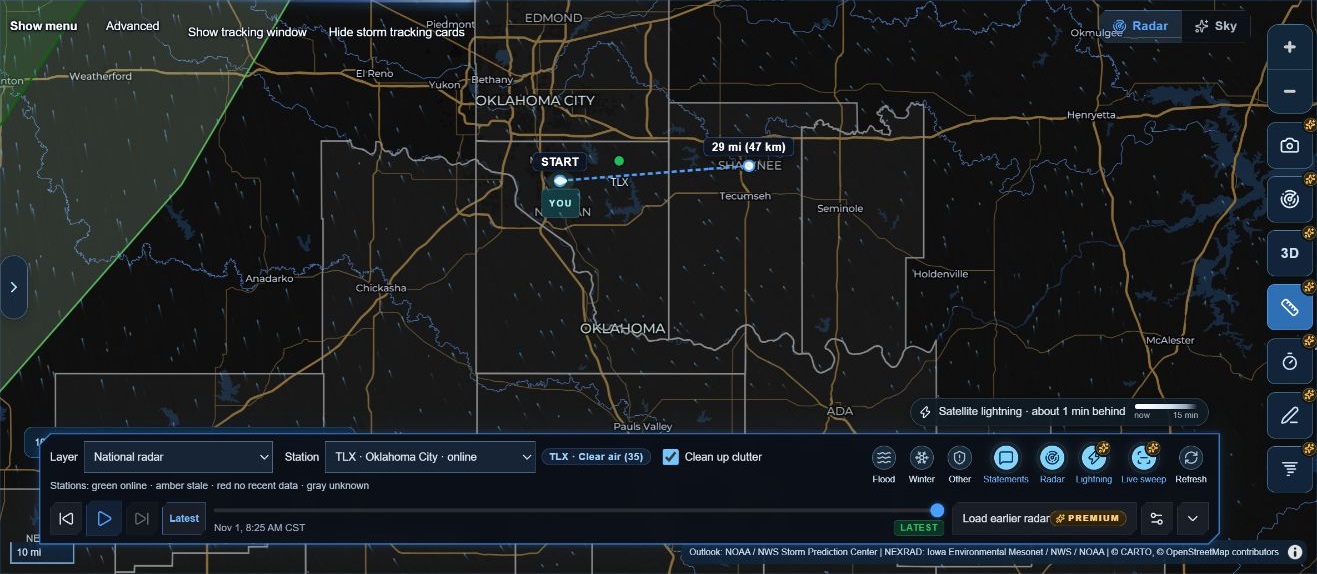
The desktop interface has several working areas. They stay connected to the same selected location, but each area answers a different question.
| Area | What you will find | What to check first |
|---|---|---|
| Location header | Search, optional device location, map pin and recent places | The selected place and whether it is an approximate center |
| Instrument strip | Nearby station conditions, temperature and wind history, rain forecast and local index | The report time and station identifier |
| What matters today | Local highlights and alert cards | Official wording, status and timing |
| Left briefing | Rain near the point, hourly charts, tracked storms, conditions and forecast | Observation versus forecast labels |
| Map menu | SPC outlook, Tracked cells, SignalCast and local-weather panels | Whether a panel is describing a location or a selected storm |
| Right map controls | Zoom, Camera, SmartSite, 3D and the four map tools | Which tool currently owns map clicks |
| Radar dock | Product, station, layers, playback, time and settings | Product, station and frame time |
| Advanced drawer | Model comparison, tropical tracking and deeper storm tools | The selected tool and its required inputs |
Hide left panel gives the map more room. Hide menu folds the list of tools; Show menu brings it back. Minimize the radar controls when you need more map space, then expand them to change products or inspect the timeline.
When the map responds differently
A drawing tool, ruler, ETA tool, location pin or Advanced point selector can temporarily use clicks that would otherwise inspect or move the map. Finish or close that tool before trying another map action. On desktop, Escape can release the active map tool; when focus is inside a text field or another panel, Escape belongs to that control first.
Back to the beginning ↑03 • Choose and revisit a location
Search accepts a named place, a ZIP code or coordinates. A place label is useful context, but the selected point is what drives location-specific calculations. A city center does not represent every address in that city.
Search or place a pin
- Enter a public place such as Norman, OK and run the search.
- Confirm the selected-place heading.
- For a different point, choose Place a pin, then click the intended spot on the map.
- Let the briefing refresh. Check the new location label before interpreting results.
Use my location is optional. It asks the browser for device location; searching or placing a pin remains available if you prefer those methods. A saved device point is a saved location, not evidence of a new device-location reading.
Recent places and local storage
Recent-location buttons reopen places you have selected. The current documentation describes up to eight recent places and a saved return point on this browser. Selecting a recent place fetches weather for that point again; a remembered place is not a saved current-weather report.
| Control or behavior | Meaning |
|---|---|
| Clear location | Stops monitoring the selected point and removes it as the return point; the recent list remains |
| Forget | Removes the saved recent list and return point |
| Open a recent place | Selects that place for a live weather check |
| Clear browser site data | Removes local preferences and device-held history |
| Open another browser or device | Local settings and watches do not automatically follow you |
Back to the beginning ↑Before removing stored data, export any storm-watch history you want to keep. Clearing a selection, stopping a watch and deleting its history are different actions.
04 • Read the briefing without mixing the evidence
StormTrak brings several kinds of information together. The label beside a value tells you how to interpret it.
| Kind of information | Example | How to read it |
|---|---|---|
| Observation | A station temperature or radar echo | A measurement associated with a place and observation time |
| Derived estimate | Radar-based rain motion or a local index | A calculation from identified inputs |
| Forecast | An NWS rain chance or a model's future radar image | Expected conditions for a future valid period |
| Official bulletin | An NWS warning, watch or advisory | Read the issuer's wording, geography and timing |
| Historical information | An earlier storm-watch observation | Useful history with its original timestamp |
| Unavailable information | A dash or unavailable notice | No usable value is being supplied; it is not zero |
Three clocks worth noticing
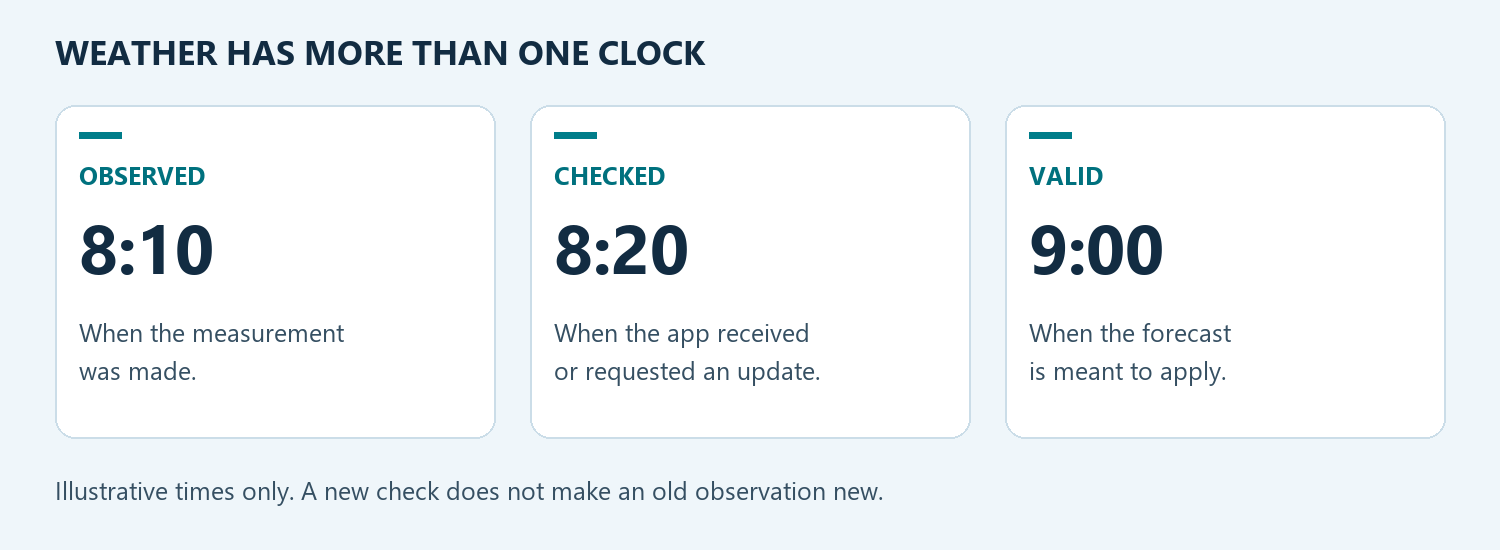
Observed tells you when a measurement was made. Checked tells you when StormTrak requested or received an update. Valid tells you which time a forecast describes. A recent check does not make an older observation new. A model run time is the starting cycle of that forecast, not necessarily the time shown in the frame.
The Hot List's quiet state is scoped to what has been identified and tracked. Read its supporting sentence and data age. It does not cancel an official warning or establish an all-clear.
Reading alert cards
Open a Hot List alert to read the details. A Last known label means the app is preserving an earlier bulletin with a status caveat. Treat that label differently from a currently confirmed alert. Follow the official source link when you need the authoritative current bulletin.
Hourly rain and temperature
The briefing offers 24-hour and 48-hour views and a Show as a table alternative. A forecast rain chance describes the likelihood of measurable precipitation at a point during the stated interval. It is not the fraction of the hour that it will rain. NWS explanation of precipitation probability.
Temperature and dew-point charts are forecasts at the selected point. They should not be read as the measured temperature history at the nearby station.
Back to the beginning ↑05 • Radar products, colors and playback
The radar dock is the place to confirm what you are viewing, where it comes from and when it applies. Start with the Layer selector. When a single-station product is selected, check the Station selector too.
| Product shown in StormTrak | Useful question | Important distinction |
|---|---|---|
| National radar | Where are radar echoes across the wider region? | A composite view, rather than one station's perspective |
| L1 · Reflectivity | Where does this station's processed reflectivity show echoes? | StormTrak's L1 label is a product label; it should not be confused with raw NOAA Level I signal data |
| L1 · Velocity | What radial motion is shown in this processed station product? | Motion is toward or away from the radar |
| L2 · Reflectivity | What structure appears in the station's Level II reflectivity? | Echo strength is not a direct tornado measurement |
| L2 · Velocity | What motion toward or away from the radar is measured? | Radial velocity is not the storm's travel speed |
| L2 · Correlation coefficient | How similar are the radar returns in the sampled volume? | Interpret alongside other products and context |
| Radar type estimate · MRMS | What precipitation type does the radar-based analysis estimate? | An estimate, with its own time and coverage |
| Satellite · Visible / Infrared | What does the satellite show? | Satellite imagery is a different observation from radar |
| Future radar · HRRR / NAM Nest / GFS | Where does this model simulate future echoes? | Forecast imagery, not observed radar |
| Precipitation type · HRRR / NAM Nest / GFS | What precipitation type does this model predict? | Model forecast, not a confirmed surface report |
Read the legend for the selected product
Reflectivity uses dBZ. Higher values indicate stronger returns, but precipitation type and non-weather targets affect interpretation. Velocity measures motion along the radar beam. A value near zero can occur when motion is mostly across the beam. NWS radar introduction.
Correlation coefficient describes the similarity of horizontal and vertical radar returns. Low values can occur in several situations; one low-colored area alone is not confirmation of a tornado. Use the surrounding reflectivity, velocity, location and official warning context. NWS dual-polarization radar guide.
StormTrak supplies a product-specific legend. Do not carry a color interpretation from one product into another. The reflectivity legend observed during this review identified green at 20 dBZ, yellow at 35 dBZ and red at 60 dBZ.
Play, step and return to now
- Select the product and, when appropriate, the station.
- Wait for the image and its time label to load.
- Press Play to animate available frames.
- Pause, step backward or forward, or use the frame slider to inspect a particular time.
- Use Load earlier radar when offered to request additional available history.
- Press Latest to return to the newest frame.
A disabled frame button can mean there is no further loaded frame in that direction. It does not by itself mean the radar service has failed. If an image is still loading, read the displayed status before assigning the new time to the pixels.
Clutter and station status
The published app includes Clean up clutter for supported reflectivity views. It is a display choice described by the app's help text. Turn it off to inspect the raw view. This guide documents the existing control; no calculation or weather-processing setting was changed to create the guide.
Station labels distinguish online, stale, no recent data and unknown states. These describe source availability, not whether a location has dangerous weather. Check another suitable station or a national view when needed, while retaining the displayed times.
Back to the beginning ↑06 • Live sweep, lightning and map layers
Live sweep paints the lowest radar tilt as data arrive on supported Level II products. It is distinct from animating a history of completed frames. The published controls include it beside Lightning, and its status can indicate the current scan or that the radar is scanning higher.
- Choose a supported L2 product.
- Check the selected station.
- Return to Latest.
- Enable Live sweep if you want that presentation.
- Read the live-sweep time and status. When you inspect historical playback or use 3D, do not expect the same live sweep to remain active.
Satellite lightning
The lightning layer uses NOAA GOES-19 GLM observations. Read the layer's lag or missing-data message. The visible legend describes recent flashes fading by age; the absence of a flash symbol is not an all-clear. A satellite flash display is not a list of exact ground-strike locations.
Current documentation describes lightning as separate from radar playback and forecast playback. A saved Lightning preference can remain on while the layer is temporarily absent from a historical or forecast view.
Flood, Winter, Other and Statements
Open the Flood, Winter or Other controls to inspect the offered alert-polygon types. Statements controls Special Weather Statement polygons. These map choices organize the display. Read the actual alert details for the meaning of a warning, watch or advisory.
Animated wind
The particle wind layer has a transparency control. Its source label identifies modeled 10-meter environmental wind and the model run and valid time. Particle motion is illustrative. It is neither a station anemometer reading nor the vector used to describe a particular storm's travel.
Back to the beginning ↑07 • SmartSite and the camera
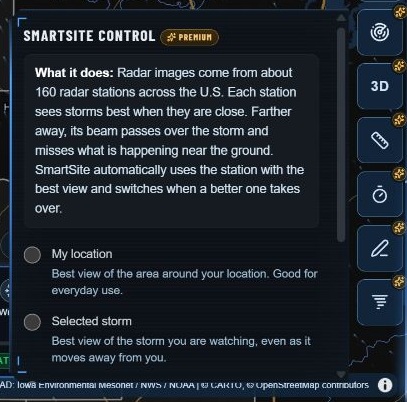
Two controls help keep the map useful as your focus changes: SmartSite chooses a radar station, and Camera controls the map view.
| SmartSite mode | What it follows | When it helps |
|---|---|---|
| My location | Radar coverage around the selected place | Everyday local monitoring |
| Selected storm | Coverage of the storm being watched | Following a moving storm |
| Manual station | Your explicit station choice | Keeping a particular radar perspective |
SmartSite works with single-station L1 or L2 views. A national, satellite or forecast layer is a different kind of view. The panel explains that state instead of treating it as a station failure.
Choosing a station directly is a temporary override in automatic operation. Manual station is the deliberate persistent lock. Choosing a new location releases a temporary override; see the current SmartSite panel for its active mode.
Camera modes
| Camera mode | Result |
|---|---|
| Free Camera (Manual) | You pan and zoom the map |
| Follow Selected Storm | The selected storm and its projected path stay in view |
| Follow Storm + My Location | The storm and selected location stay in view together |
| Follow Radar Station | The map centers on the selected radar station |
Choose a storm to watch in SignalCast before using storm-follow modes. Automatic zoom is a separate option. Moving the map yourself pauses automatic following; Resume returns to following. Pause holds the view without changing the chosen mode. Weather updates and watching continue independently of camera movement.
Back to the beginning ↑08 • Follow a storm with SignalCast
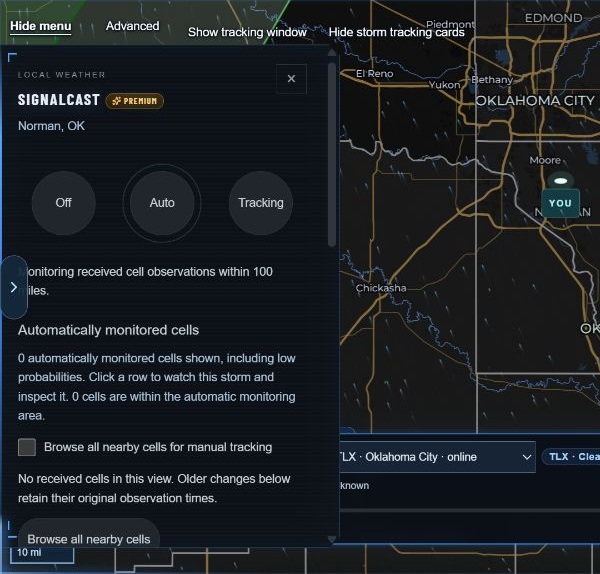
SignalCast organizes received storm observations and changes over time. Open it from the map menu. Its controls distinguish Off, Auto and Tracking, and it also provides access to deliberate saved watches.
Begin with the displayed list
- Open SignalCast.
- Read the monitoring-area description and the times on the observations.
- Inspect a cell row when one is available. Use the offered watch action to follow that storm.
- Open the tracking window to inspect direction, timing, probabilities and saved changes.
- Use Tracking details and the saved-observation section when you need the evidence behind a summary.
Browse all nearby cells broadens inspection beyond the automatic view. ProbSevere observations and independent radar cells are identified separately. Radar cells do not automatically receive the probabilities of a different source.
A watch is also a history
Deliberately started watches and their observation/change history are stored on this device. When an old watch is restored, earlier observations retain their original times. Awaiting a verified observation does not mean the old observation has become current again.
| Action | Result described by the current application |
|---|---|
| Stop | Stops the watch and keeps its history |
| Export history | Saves a local JSON copy of the watch history |
| Delete history | Removes the saved record |
| Hide tracking window or cards | Changes visibility; it is not the same as stopping the watch |
Changing the selected location changes the distance and impact context; it does not turn a historical observation into a new one. Keep the cell identity, source and observation time together when comparing changes.
Voice and history
The header includes Voice alerts and Voice History. Spoken information supplements the visible evidence. A restored historical watch is not proof of an active warning. Do not assume that an open-browser voice feature guarantees delivery when the page or device is asleep; background-notification behavior is outside this edition's verified coverage.
Back to the beginning ↑09 • Understand movement and arrival estimates
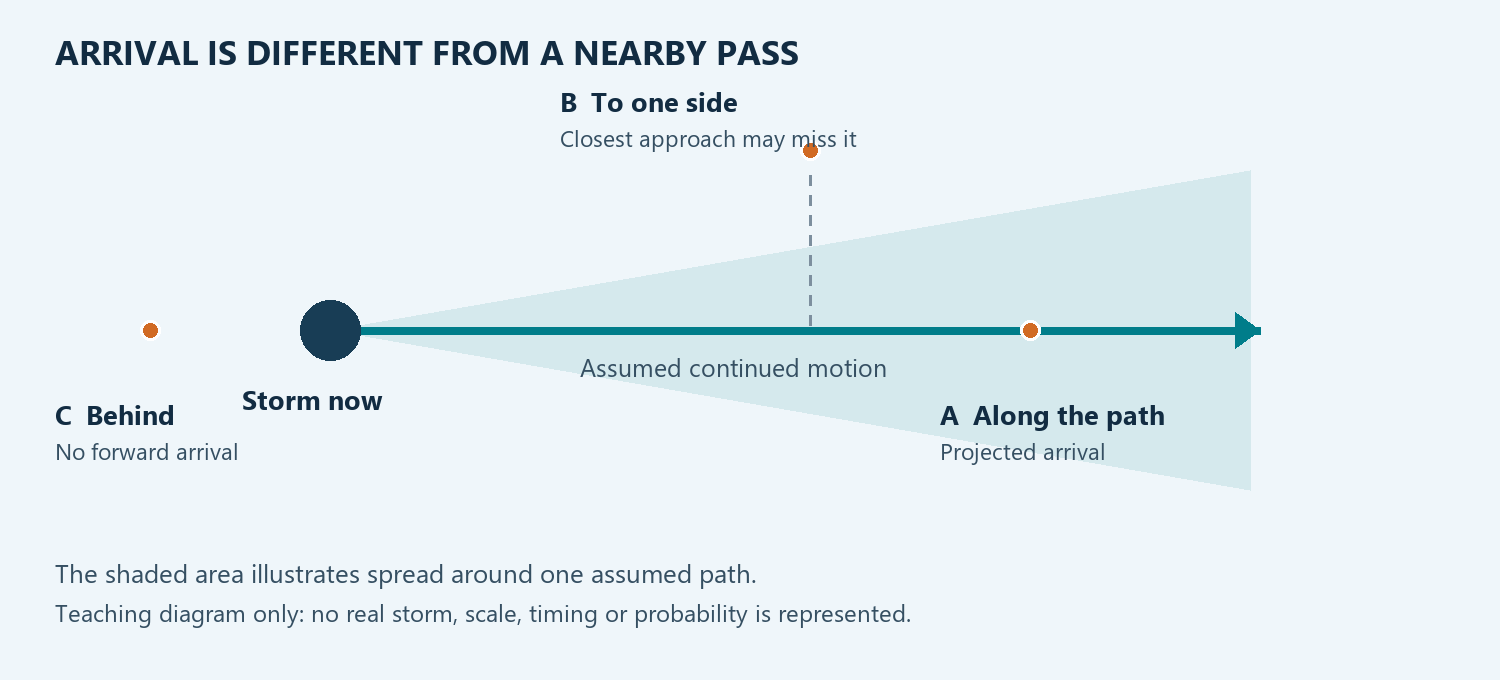
An arrival estimate is conditional: it depends on the motion and position used in the calculation. Storms can change speed, direction, size and intensity. The selected location can be inside a storm's observed footprint, near a projected path, beside it, or behind its direction of travel.
| Wording or state | What to inspect |
|---|---|
| At your location / observed overlap | Which observed footprint covers the selected point, and at what time |
| Projected arrival | The motion source, position time, target and assumption of continued motion |
| Arrival range | The stated uncertainty and time interval |
| Closest approach | The expected nearest pass; this is not necessarily an arrival at the target |
| Behind the storm | Whether the chosen target lies opposite the current projected motion |
| Stationary | A zero-motion case does not provide a future travel time |
| Previous estimate / historical | The original time and why the estimate is now historical |
| Unavailable | Which necessary input is absent |
Do not merge unlike speeds
A station wind reading describes air at the station. A model wind field describes forecast environmental wind. Doppler velocity is motion along the radar beam. A storm-motion estimate describes a storm's travel. They can differ without contradicting one another.
A simple teaching example
For a hypothetical point directly along a constant 30 mph track, 15 miles of remaining travel corresponds to 30 minutes. That arithmetic is useful for understanding units. It is not a StormTrak forecast, and it does not account for a changing storm footprint, motion uncertainty or a target to one side. Use the app's actual result and its labels for real interpretation.
Back to the beginning ↑10 • Measure distance and bearing
The new Measure distance & bearing tool is the ruler icon in the right-hand map controls. It measures geometry; it does not determine a storm's motion or issue an arrival forecast.
- Select the ruler.
- Click a starting point on the map.
- Move toward the next point to inspect the live distance and bearing preview.
- Click additional points to add segments and running totals.
- Double-click, or click the last point again, to finish.
- Press Escape while focus is on the map/tool, or use the ruler button, to clear the measurement.
Practical use
Use the ruler to compare separations on the map or sketch a multi-segment route. A straight geographic separation is different from a road distance. Read miles and kilometers as two unit representations of the same measurement.
Bearing describes direction from one point to another. It does not establish the direction a storm will travel. To understand timing, use the storm-specific tools and check their motion source.
The ruler temporarily takes map input. Finish or clear it before expecting a click to open a warning or station. Its geometry is temporary page work, not a saved storm watch.
Back to the beginning ↑11 • Draw and explain what you see
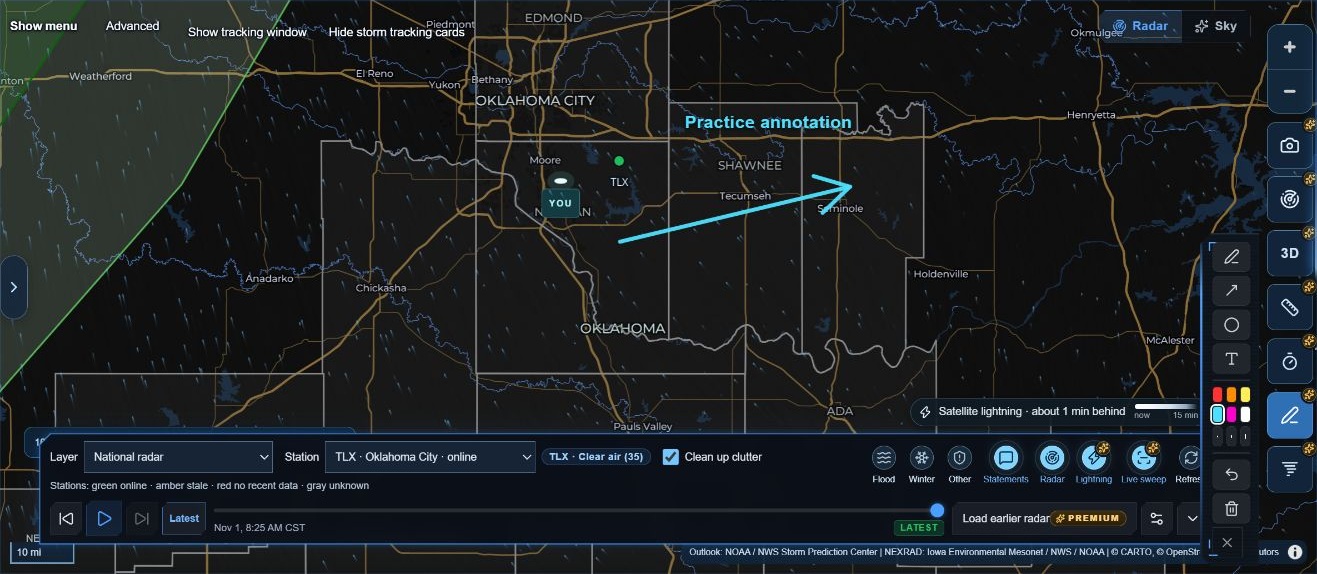
The new Drawing tool is the pen icon in the right-hand column. It offers freehand pen, arrow, circle and text, together with six colors, three widths, Undo and Clear.
| Tool | Gesture | Useful for |
|---|---|---|
| Freehand pen | Drag to sketch | Marking an area or tracing a feature |
| Arrow | Drag from tail to tip | Pointing to a feature |
| Circle | Drag outward from the center | Highlighting a region |
| Text | Click, type, then press Enter | Adding a short explanation |
| Undo | Select Undo last drawing | Removing the last annotation |
| Clear | Select Clear all drawings | Removing the current drawing set |
Choose a color and line width before drawing. While a drawing gesture is active, dragging draws instead of panning. Close the palette or leave the active tool to return to ordinary map interaction.
Annotations are attached to geography, so they remain over their map positions when the view moves. Closing the palette leaves drawings in place. The current release keeps drawings in this page session; it does not provide a saved drawing library.
Make an annotation understandable
Use labels such as “area to inspect” or “example path” when a mark is explanatory. An arrow drawn by a person should not be mistaken for a measured motion vector. Keep the radar product, time and official-warning context visible when sharing an interpretation.
The text-label, arrow and Undo workflows were exercised for this edition. Pen, circle, tablet-pen behavior and every styling combination remain listed in the coverage notes for further interaction checks.
Back to the beginning ↑12 • Storm ETA: check one target
The new Storm ETA tool is the timer icon. It uses the motion associated with a warning, a storm position you select, and a target point. It is a separate workflow from the location-based timing shown elsewhere in StormTrak.
- Find the relevant tornado or severe-thunderstorm warning on the map.
- Select Storm ETA.
- Click the storm's current position inside the warning.
- Click the target you want to examine.
- Read the result as a projected arrival or closest approach, together with the elapsed time and clock time.
- Clear the tool when finished before using other map-click actions.
The release documentation describes a 30-minute projected track. The wording distinguishes a target behind the storm, a stationary storm and a closest pass. Do not replace an unavailable arrival with your own assumed speed.
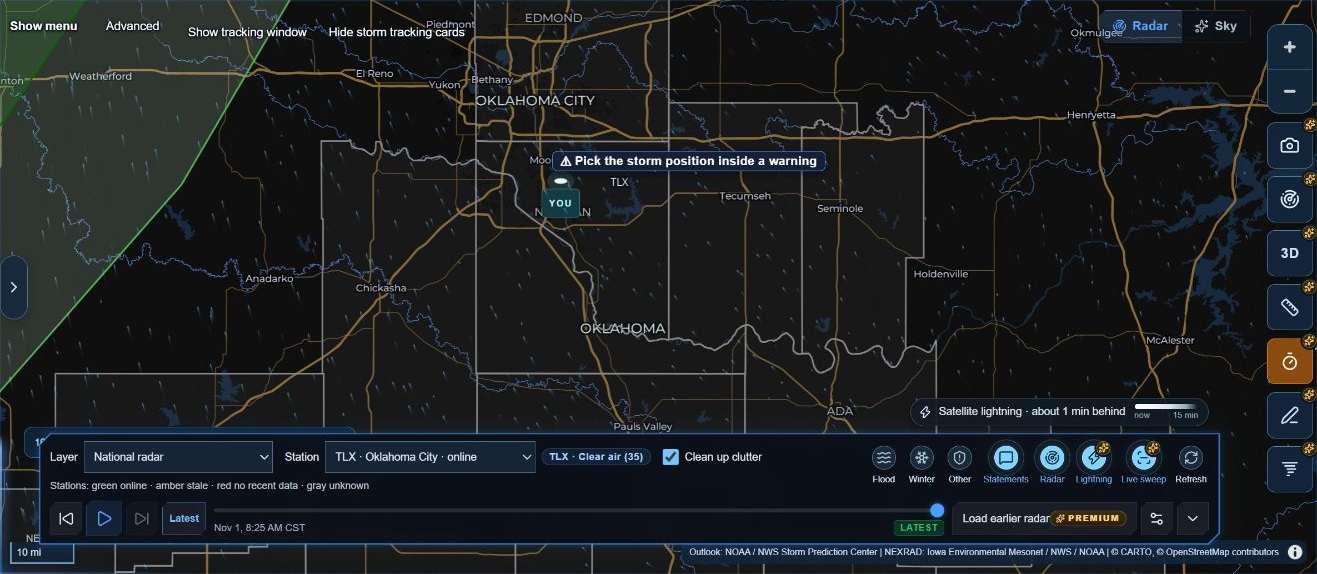
Back to the beginning ↑Verification note: activation and the no-warning response were observed. An actual live-warning arrival card was not produced during this review. The positive-result workflow above follows the current release documentation and still needs an illustrated live or explicitly labeled replay case.
13 • StormTrak Impact: examine towns along a path
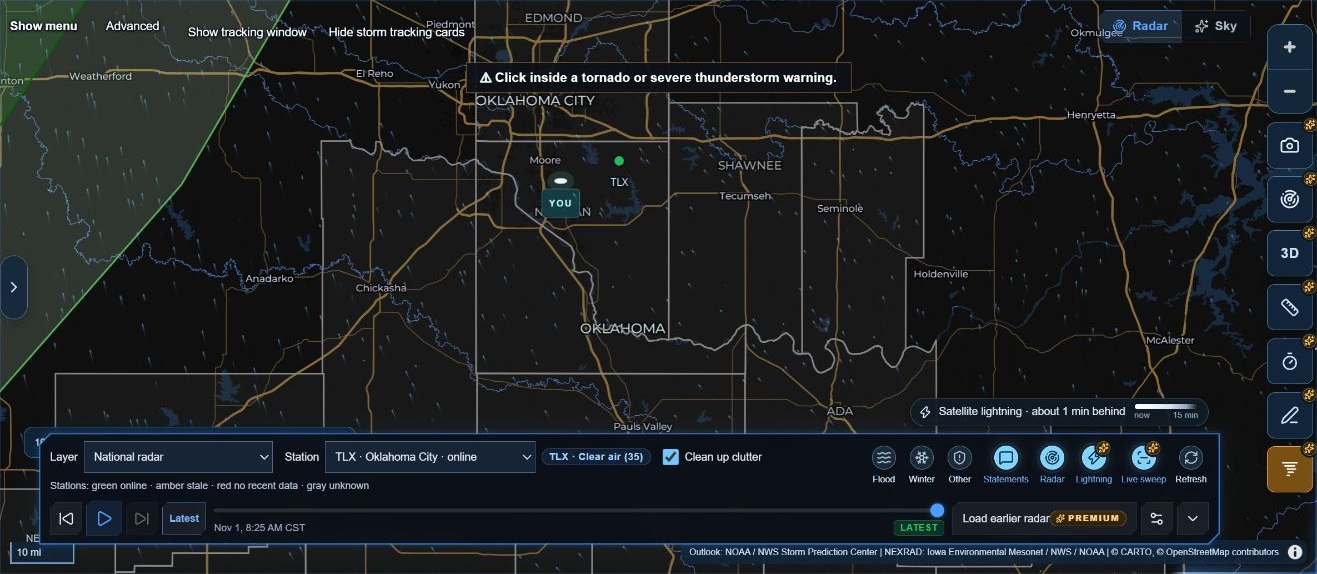
The new StormTrak Impact tool is the tornado-style icon below Drawing. It starts with a tornado or severe-thunderstorm warning and presents a projected track with affected-town information.
- Select StormTrak Impact.
- Click inside the relevant warning polygon.
- Read the motion source, direction, speed and projection time.
- Inspect the town rows. Distinguish NWS pathcast times from calculated projected arrivals.
- Read off-track, locating or unavailable states literally. A town without an ETA is not a guaranteed miss.
- If investigating a different speed, use the card's speed field and Apply, then treat the changed-speed result as that scenario.
The current release documentation describes a two-hour straight-line projection and a movable, resizable card. It keeps NWS-supplied arrival clocks labeled separately from calculated times. Towns that do not lie ahead on the projected path can remain listed as off track.
When a warning ends, the documentation describes the card changing to a historical state with live countdowns removed. A later warning revision can update the projection. The continuing presence of an old card is not proof that a warning remains active.
Choose the right timing tool
| Your question | Start with |
|---|---|
| What might affect my selected location? | The local briefing and tracked-storm view |
| What has changed in this storm? | SignalCast and its observation history |
| What happens at one chosen target? | Storm ETA or Advanced → Compare a map point, according to the source being inspected |
| What towns are along this warning-based projection? | StormTrak Impact |
| What communities intersect a selected storm's corridor? | Advanced → Communities in the path |
Back to the beginning ↑Verification note: Impact activation and the no-warning response were observed. The town table, speed-change result, warning-revision update and historical transition require a suitable warning case and remain unverified in this edition.
14 • Local observations and history
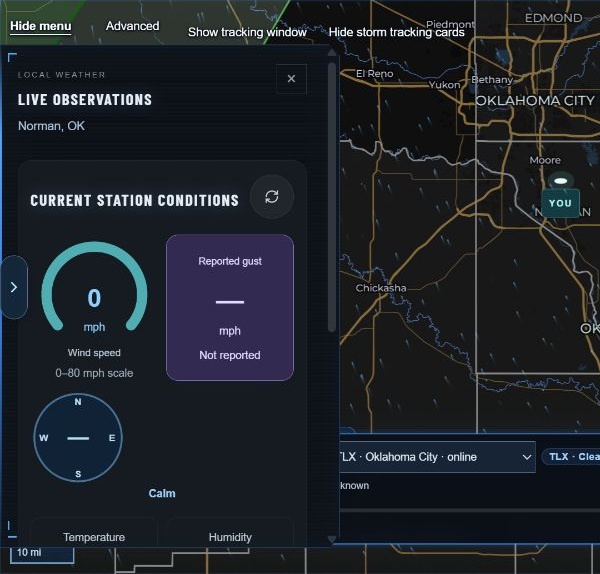
Live Observations describes a nearby reporting station. The panel identifies the station and its distance from the selected location. It may show temperature, wind, humidity, dew point, heat index and a reported gust when available.
Zero and missing mean different things
The panel explains that zero wind means reported calm, while a dash means not reported. A nearby station can report different conditions from those at your exact point. Check its report time even if the panel was recently refreshed.
Inspect a history
- Open Wind / Temp History, or select the corresponding instrument strip.
- Choose 1H, 6H, 12H or 24H.
- Read the latest report time. The chart window ends at that report, not necessarily at the current minute.
- Use Inspect a report or the table to read exact values.
- Compare the wind and temperature plots while keeping missing-value gaps visible.
The graphs connect available reports. The current panel explains that gaps over 90 minutes break the line and that average wind is the average of available reports, not a time-weighted continuous measurement. A gust appears only when reported.
This review changed the history from 12H to 6H and observed the report count and summary change, then restored 12H. Table and report-slider inspection are useful follow-up checks listed in the coverage record.
Back to the beginning ↑15 • The Local Threat Index
The Local Threat Index combines contributions from several weather sources into a local engineering index. It is not an official NWS severity level and is not a percentage chance of a tornado or another hazard.
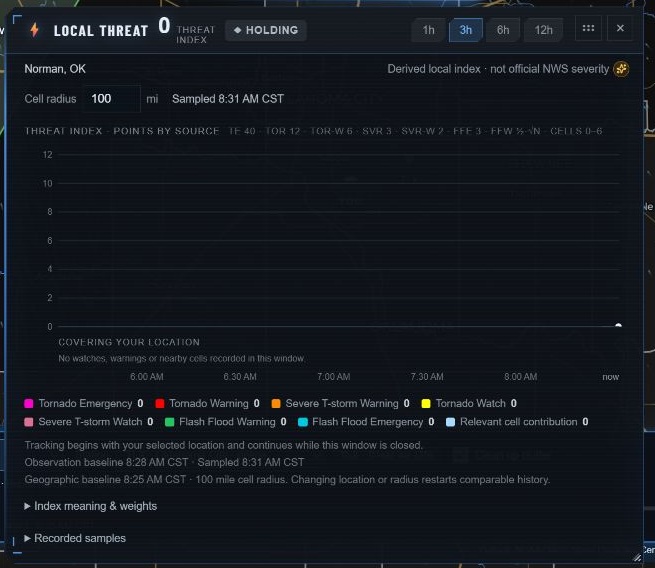
Open the index from the instrument strip or map menu. The window provides time ranges, source contributions, a cell-radius setting, the sampling time, baseline information, Index meaning & weights, and recorded samples.
Reading the chart
Start with the selected location, radius and baseline. Then inspect how the contributions change over time. The legend separates watches, warnings and relevant cells rather than treating them as one interchangeable signal.
The current panel explains that hatched spans represent known contributions with incomplete totals. An incomplete total should not be read as a complete low value. Changing location or radius starts a new comparable geographic baseline.
Closing the index window does not stop its location-based tracking. The word Holding describes an index trend; it does not promise that weather conditions cannot change. Read official alerts independently.
Back to the beginning ↑16 • Forecasts and model comparison
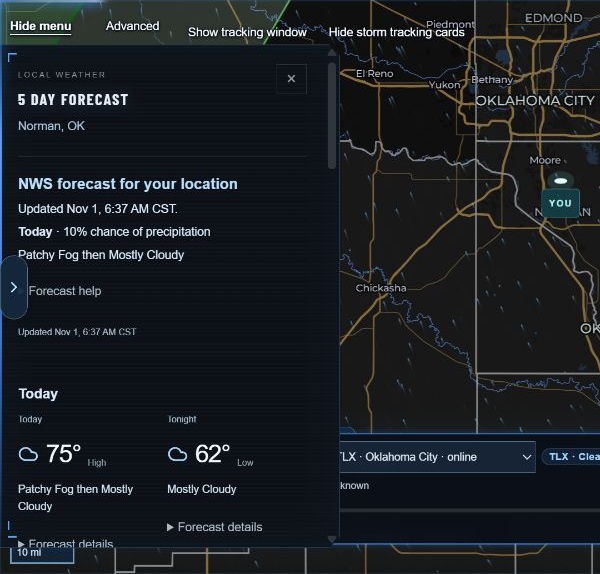
The local briefing and 5 Day Forecast panel present the NWS forecast for your selected point. Read the update time and open Forecast details for the full period wording. The panel title is a navigation label; inspect the dates of the periods actually supplied.
Future radar
In the Layer selector, Future radar · HRRR, NAM Nest and GFS show simulated reflectivity. The frame must be read with its model, initialization and valid time. It is not the radar observing a future storm.
The related Precipitation type model layers are also forecasts. A predicted precipitation type should not be presented as a confirmed report at the surface.
Compare forecast models
Open Advanced → Compare forecast models. Choose Temperature, Precipitation, Wind, Gusts or Rain / snow / ice. Swipe or scroll across the table for later valid times. Read the actual column times: the current comparison exposes retained forecast hours across different model horizons, so do not assume every column is three hours apart.
The precipitation metric is liquid-equivalent accumulation over the three hours ending at the column time, including snow and ice. Missing accumulation periods remain blank. Wind and Gusts are separate fields. Rain / snow / ice describes instantaneous model precipitation types at that column time; mixed types can be shown together.
Each model row has its own initialization selector. Choose a retained run to inspect that forecast, or use the newest full run when offered. The panel identifies runs still arriving and models outside their coverage or available range. About this comparison explains the sampling and time alignment.
Compare the same valid period and units. Blank values can reflect unavailable fields or a model's available horizon. Model disagreement helps you see uncertainty; it is not, by itself, a calibrated probability. An arithmetic average of several models is not an official NWS forecast.
If you use Choose map point, the point selection is temporary inspection. Confirm the point shown in the comparison before interpreting its numbers.
Back to the beginning ↑17 • Official outlooks, warnings and tropical systems
SPC outlook supplies a broader severe-weather outlook. Select the offered day and product and read the issue/valid period. An outlook concerns potential severe weather over an area and time period; it is different from a warning for an ongoing or imminent event.
Warning explorer
Open Advanced → Warning explorer to browse received severe warnings by distance and inspect hazards, timing and instructions. When a full-bulletin speech control is offered, it is another way to hear the bulletin; the written official text remains available to read.
A blank list, a no-active-warning message and an unavailable-feed message are different states. Read the actual status rather than inferring one from an empty map.
Hurricane tracker
Open Advanced → Hurricane tracker for official NHC and CPHC tropical-cyclone information. The tool's documentation describes advisory selection, forecast points, tracks and cones. Check the storm identity, advisory and valid times together.
The NHC cone concerns uncertainty in the path of the cyclone's center. It is not the storm's size or the boundary of all hazards. NHC definition of the forecast cone. Local impacts can extend beyond that cone; read the official local products as well. NWS hurricane guidance.
The absence of an active cyclone in a list is not a demonstration of forecast-point or cone interaction. Active-storm examples are recorded separately in the coverage notes.
Back to the beginning ↑18 • Advanced storm analysis
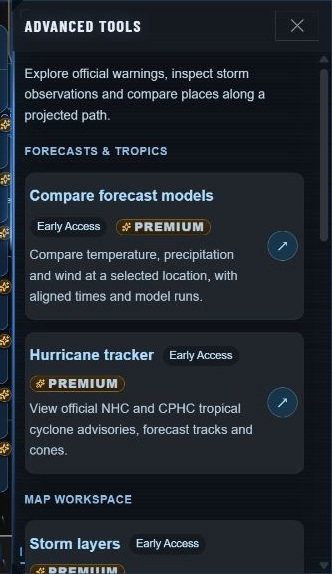
The Advanced drawer groups deeper tools by purpose. It includes forecast comparison and tropical tracking, map presentation, official weather, and storm analysis.
| Tool | Purpose | Start with |
|---|---|---|
| Storm layers | Show or hide observed cells, projected corridors, motion tracks and uncertainty | A map view where you can identify the layer being changed |
| Storm observations | Inspect probabilities, radar-estimated hail and lightning measurements | A selected storm and its source times |
| Communities in the path | Inspect community centers along the chosen storm's projected corridor | A selected storm and usable motion |
| Compare a map point | Inspect warnings and the chosen storm's projected arrival at a temporary target | A map point or entered coordinates |
A useful inspection sequence
Choose the storm, inspect its observations, check its reported motion, and then compare targets or communities. Keep its identity and observation time visible. A probability from one source is not an observed event, and a missing probability should not be silently filled from an older row.
During this review, Storm observations displayed NOAA cell 41236 with an observation time, a reported eastward motion of 9 mph, and a 1% probability of any severe weather. The panel explicitly applied that probability to the storm during the next hour. It was not a 1% chance of impact at Norman or at another selected point. This dated example illustrates how to read the scope of a probability; it is not a current storm assessment.
Manage visual layers deliberately
Observed cells, projected corridors, uncertainty and motion tracks describe different things. Turning one off changes what you see. It does not make the other evidence more certain. Reset tools and display only when you intend to restore the offered defaults; saved display choices can change.
Back to the beginning ↑19 • 3D radar and 3D Studio
The 3D button offers a spatial view of a radar volume. It works alongside the ordinary radar map. A displayed volume is radar data rendered in three dimensions; it is not a photograph of a cloud or a direct depiction of a tornado.
On the map
- Choose a suitable radar station and view.
- Select 3D.
- Check the station and scan time.
- Choose Reflectivity or Velocity.
- Adjust the displayed threshold and Stretch height to examine the structure.
- Use Flat radar under the 3D, Orbit or North up as appropriate.
- Turn 3D off to return to the flat map.
Height stretching is visual exaggeration. It should not be read as the actual measured height without accounting for that scale. Similarly, a display threshold controls what portion of the field is visible; it does not change the underlying weather observation.
3D Studio
3D Studio opens the fuller 3D window. The current documentation lists Points, Surface, Shells, Velocity, Volume and Vel·Vol, together with loop and mark controls. Your selected place serves as its mark. Close the window or use Escape to return to the map.
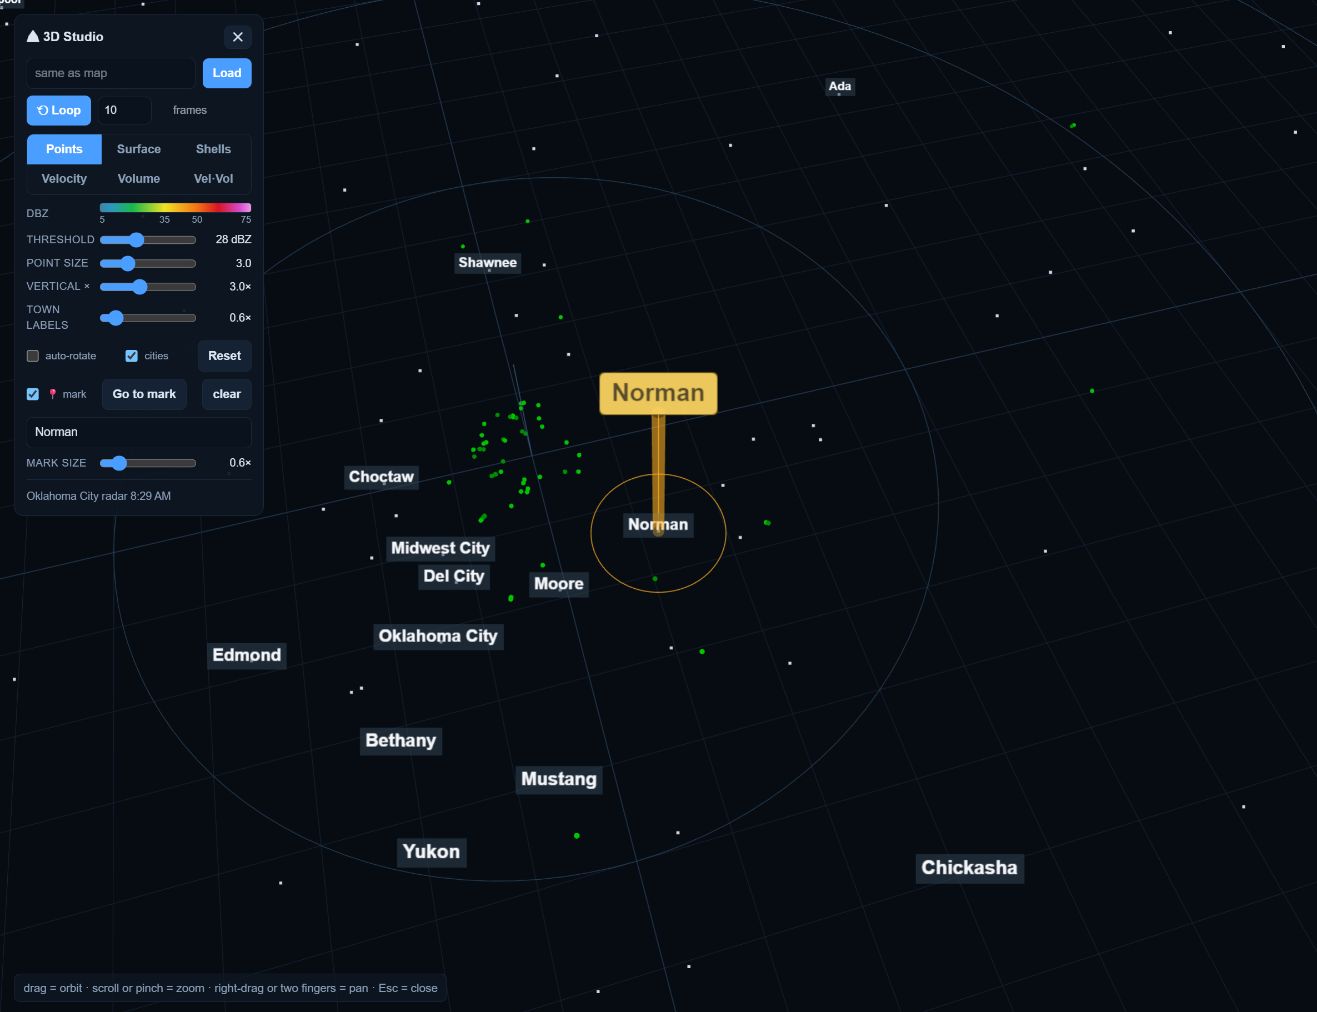
The current release's 3D tool is offered on desktop and suitable tablet layouts, not the phone layout. Volume downloads and graphics capability affect loading. Read an unavailable or old-scan label instead of assuming that an empty volume means no weather.
This review loaded the on-map 3D scan, opened Studio, switched from Points to Volume and back, and closed it successfully. It does not claim a verified active-storm 3D interpretation or physical-device performance certification.
Back to the beginning ↑20 • Explore the sky
StormTrak Sky is a panoramic sky view for the selected location. Open it from the map menu or the Sky view switch. The display includes calculated celestial positions and a details area with local sun and moon information.
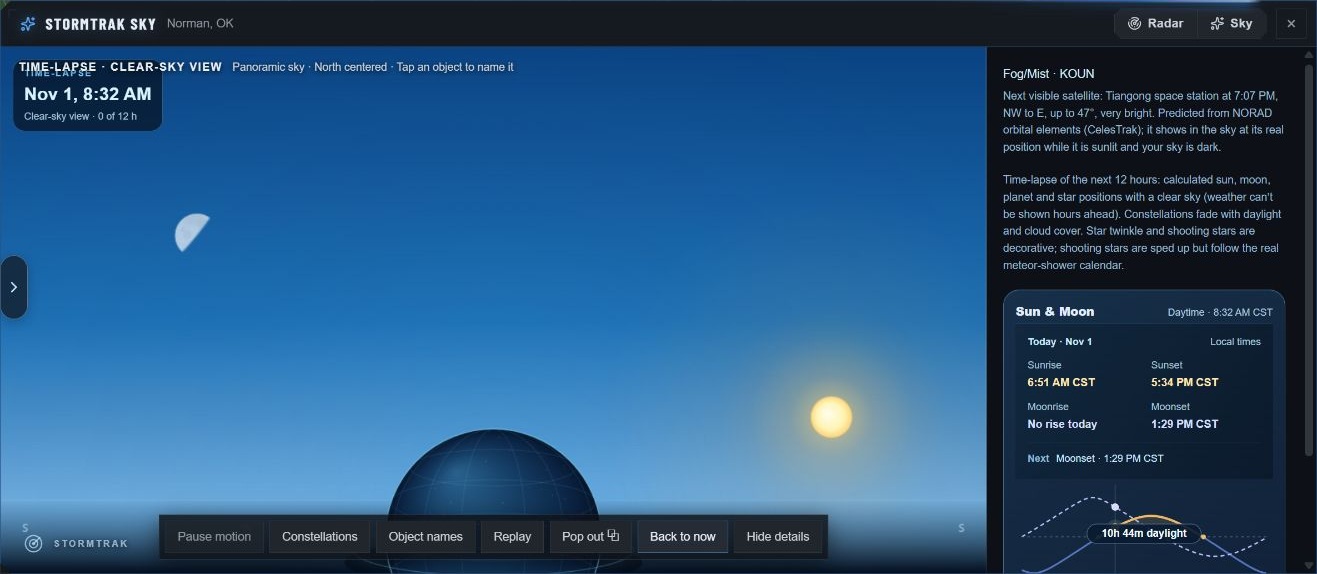
Controls to try
- Constellations controls constellation drawing.
- Object names adds names to the view.
- Pause motion controls the live animation where available.
- Next 12 hours in 30 s starts a time preview; Back to now restores the live-time view.
- Hide details gives more room to the panorama.
- Radar or the close control returns to the map.
The panorama centers north, with west to the left and east to the right; south meets at the outer edges. The details identify the next relevant sun/moon event and explain object positions.
The live UI explains that its time preview uses a clear sky because future weather is not shown there. It also identifies decorative twinkling and shooting-star animation. Satellite passes are predictions from orbital elements, not a guarantee of visibility through clouds.
The review exercised Object names, the twelve-hour preview, Back to now and return to radar. Pop-out behavior and external-window support remain browser-specific follow-up checks.
Back to the beginning ↑21 • Use the phone layout
StormTrak adapts its controls for a smaller screen. The bottom navigation has Radar, Now, Forecast, Alerts and More. Radar provides the map and compact timeline; Now provides the local status; Forecast provides the NWS periods; Alerts provides official-alert information and notification controls; More provides location, Advanced tools and display options.
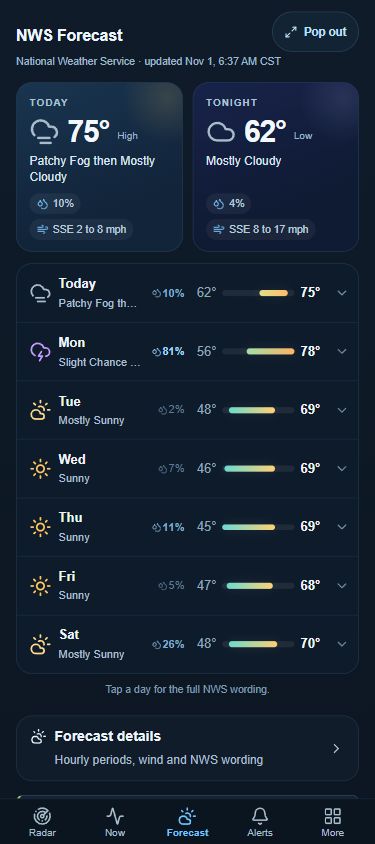
Use Search for a place, Map layers and Center the map on your place in the map's compact control stack. Tap the radar product strip to open its product and settings controls. The review opened each bottom-navigation section and expanded a forecast day. After resizing from a desktop session, Forecast and More initially appeared empty; reloading at phone width restored their content. This is a recorded layout issue, not proof that the forecast feed was absent.
The current map-tools documentation says Measure, Storm ETA, Drawing and Impact are offered on desktop and tablet, and are hidden at phone width. The 3D documentation likewise excludes the phone layout. Their absence on a phone does not prove that the desktop deployment failed.
Use a landscape or larger-screen view when you need tools that are not offered in the phone interface. Device rotation, touch gestures, graphics performance, sound delivery and operating-system background behavior need device-specific checks.
The Alerts page offers Push alerts → Set up and describes delivery when StormTrak is closed. Setup, permissions, subscription and actual background delivery were not exercised for this guide. Voice alerts and push delivery are separate capabilities.
This guide's responsive-browser checks are identified in the coverage record. A resized desktop browser is a useful layout check, but it does not establish physical iPhone or Android behavior.
Back to the beginning ↑22 • Troubleshooting by symptom
| What you see | What to check or try |
|---|---|
| The weather seems to describe the wrong place | Read the selected-place heading. Panning the map is different from selecting a monitoring point. Search or place a pin deliberately. |
| A reading is older than the last refresh | Compare Observed with Checked. The station may not have issued another report. |
| Radar is blank or still loading | Check the product, station, source time, visibility control and loading message. Try a suitable alternate station or National radar. |
| Live sweep is absent | Confirm a supported Level II product, Latest, the Live sweep preference and the reported availability. Historical playback and 3D use different views. |
| Storm ETA asks for a warning | The first point must identify a storm inside a suitable warning. A random point does not supply its motion. |
| Impact will not produce a town list | Check that the selected warning is a tornado or severe-thunderstorm warning, then read any motion or lookup message. |
| Dragging draws instead of moving the map | Exit the drawing tool or close its palette before panning. |
| Map following stopped | Manual movement pauses following. Check Camera and use Resume when appropriate. |
| A station keeps changing | Inspect SmartSite. Automatic modes may select a better station; Manual station is the deliberate lock. |
| A probability or gust is a dash | The field is not reported or unavailable. Do not replace it with zero. |
| The index or a chart has just started | A new place or radius can establish a new baseline. Read the baseline time. |
| A saved watch is old | Read its original timestamps and current verification state. Reopening history does not refresh its observations. |
| A forecast disagrees with radar | Check whether one describes future conditions and the other an observation. Also compare their locations and times. |
| A desktop tool is missing on a phone | Check the layout support described in the tool chapter. |
| A panel takes over map clicks | Finish its point-selection operation or close the active tool, then try the map again. |
Report a useful problem
Use Report a problem and describe the selected public location, tool, expected behavior, actual behavior, and the time shown in the app. A screenshot can help when it includes the product and status. Review it for personal locations or account information before sharing. This guide's review did not submit a feedback report or change account settings.
Back to the beginning ↑23 • Glossary and quick reference
| Term | Plain-language meaning |
|---|---|
| Bearing | Direction from one point toward another, usually expressed in degrees |
| Cell | A storm object identified and followed by a particular data source or analysis |
| Closest approach | The projected nearest pass to a point, which may be to one side |
| Correlation coefficient / CC | A radar measure describing similarity of returns from differently polarized signals |
| dBZ | A logarithmic unit used to express radar reflectivity |
| Dew point | The temperature to which air would need to cool to reach saturation |
| ETA | Estimated time of arrival; read its motion assumption and time reference |
| GLM | Geostationary Lightning Mapper, the satellite instrument used for the lightning layer |
| GFS | A NOAA global numerical forecast model |
| HRRR | High-Resolution Rapid Refresh, a NOAA forecast model |
| L1 / L2 | StormTrak's imagery choices; L2 uses NEXRAD Level II fields, while the app's L1 label refers to its processed single-site products |
| MRMS | Multi-Radar/Multi-Sensor analysis; inspect the product's own units and time |
| NAM Nest | A higher-resolution nested NOAA forecast-model domain |
| NHC / CPHC | National Hurricane Center / Central Pacific Hurricane Center |
| NWS | National Weather Service |
| Observation time | When the source measurement was made |
| Pathcast | Location-and-time information in an official warning; retain the source label |
| PoP | Probability of precipitation for a point and stated interval |
| ProbSevere | A NOAA storm-analysis source supplying identified storm objects and hazard probabilities |
| Radial velocity | The component of motion toward or away from a radar |
| Reflectivity | A measure of the strength of returned radar energy |
| Run / initialization | The starting cycle of a model forecast |
| SPC | Storm Prediction Center |
| Valid time | The time or period a forecast describes |
| VCP | Volume Coverage Pattern: a radar's scanning strategy |
A dependable reading order
Place → official alert → source time → observation → projected movement → uncertainty → deeper tools.
Choose a learning path: begin with chapters 1–6 for everyday use; add 7–15 for storm monitoring and the new map tools; use 16–20 for forecasts, Advanced analysis, 3D and Sky.
Back to the beginning ↑24 • Sources, coverage and next illustrations
Product reference
The guide was prepared from visible interaction with StormTrak on November 1, 2026 and the current local product documentation. The new-tools release reference is 20261101-maptools1, source commit 929eb1acf65181238d7149a783d17811bb238fb9. That is the recorded source reference; the guide review did not independently reconcile the running server artifact to that commit.
The source materials include MAP-TOOLS, SETTINGS, RADAR3D, LIVESWEEP, LOCAL-MONITORING-BUNDLE, FORECAST-TROPICS and the Advanced-tool registry. Old release screenshots were not presented as new captures. No application source or deployment was changed to write this guide.
Scientific reading
- NWS: Using and understanding Doppler radar
- NWS: Doppler and dual-polarization radar
- NWS: Probability of precipitation
- NOAA Radar Operations Center: Level II data types
- NHC: Definition of the forecast cone
- NWS: Hurricane preparedness and impacts
How this edition describes verification
Observed means the named interaction or state was seen in the live browser during this review. Source-documented means the instructions were checked against current product documentation but the result scenario was not reproduced. An observed launcher is not proof that every downstream result works.
The separate coverage record accompanies this guide. It lists the exact browser checks, screenshots and remaining gaps. The most important next illustrations are a suitable warning's Storm ETA result, an Impact town table and historical transition, a current tracked-storm history, an active tropical system, and richer precipitation in 3D. These require real source conditions or an explicitly labeled controlled replay.
Keep the guide current
When a release changes a control, update the workflow, screenshot and coverage entry together. Preserve the original screenshot date and identify simulated diagrams. Check desktop and phone navigation separately. The guide is a working edition with documented limits, ready to expand as those cases are verified.
Back to the beginning ↑